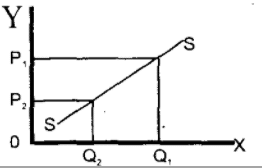
is the movement or change in Supply along the same Supply curve. This shows an increase or decrease in quantity supplied as a result of a fall or risen price respectively.
The above graph shows that at OP1, quantity OQ1 is supplied. And as price falls to 0P2, supply decreased to OQ2 respectively.
EXCEPTIONAL SUPPLY CURVE:
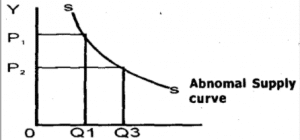
This curve is exception to the law of supply. They are abnormal supply curve, and a rise in price does not affect or attract a rise in quantity supplied.
This situation could be seen under the following conditions:
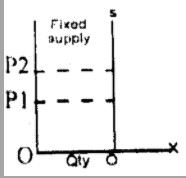
Fixed supply: This is a situation when goods or products supplied remain steady without variation. The price (either high or low) does not affect the quantity to be supplied.
Regressive Supply Curve: This is a situation when the wages of workers are highly paid; the workers earn enough to provide for their families. That is, supply is increased or decreased without increase or decrease in price.
CHANGES IN QUANTITY SUPPLIED
This is caused only by a change in the price of the commodity being supplied. It involves a movement along a single supply curve in obedience to the law of supply.
CHANGE IN SUPPLY
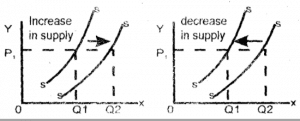
This involves a shift in the supply curve to the right, indicating increase in supply or to the left, indicating a decrease in supply when there is no change in the price of the commodity.
CAUSES OF CHANGES IN SUPPLY
- Changes in the cost of production
- Technological development when there is a new method in production that brings about increased output at a lower cost, it leads to increase in supply.
- Effects of taxation: Tax imposition on a product is likely to affect the price.
- Effects of weather: refers to agricultural products.


