Tools of economic analysis includes tables, charts and graphs. See detailed info below:
TABLES:
This is a systematic arrangement of data in columns and rows. The use of tables in Economics help to state out the summary of events with titles and units. Example:
RELEVANCE OF TABLES IN ECONOMICS
- It provides for easy understanding and interpretation of data/information
- It helps in calculating derived quantities
- It is used to summarize data and for introduction of lessons
CHARTS
are sketches that show the relationship between variables,
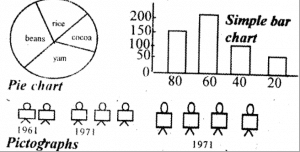
TYPES OF CHARTS
- The pie chart
- Pictorial chart
- The bar chart
- Statistical chart
RELEVANCE OF CHARTS
- It is used to show a vivid presentation of economic and statistical results.
- Serves for introduction of lessons.
- It provides for easy understanding of pictures of a data.
- It also shows relationship between variables.
GRAPH
This is a statistical representation drawn to show the relationship between variables.
RELEVANCE OF GRAPHS IN ECONOMICS
- It helps in illustrating some basic concepts
- It indicates the association of two or more variables.
- It helps for easy understanding of information represented in a graph.
- It is used to introduce lessons.
- It also serves for strengthening of points.